Visual Causality Analyst
A prototype Visual Analytics framework for causality analysis. The system features a set of interactive facilities to enable domain users to test and adjust causal relations derived from observational datasets by causal inference algorithms.
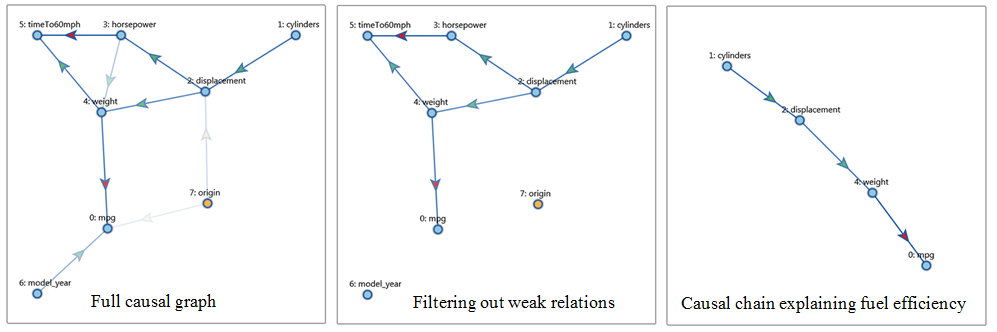
Teaser
Causal analysis of a car dataset
Paper
J. Wang and K. Muller, “The Visual Causality Analyst: An Interactive Interface for Causal Reasoning,” IEEE Trans. on Visualization and Computer Graphics (VAST15), vol. 22, no. 1, pp. 230-239, 2016 Paper / Talk
Abstract
Uncovering the causal relations that exist among variables in multivariate datasets is one of the ultimate goals in data analytics. Causation is related to correlation but correlation does not imply causation. While a number of casual discovery algorithms have been devised that eliminate spurious correlations from a network, there are no guarantees that all of the inferred causations are indeed true. Hence, bringing a domain expert into the casual reasoning loop can be of great benefit in identifying erroneous casual relationships suggested by the discovery algorithm. To address this need we present the Visual Causal Analyst – a novel visual causal reasoning framework that allows users to apply their expertise, verify and edit causal links, and collaborate with the causal discovery algorithm to identify a valid causal network. Its interface consists of both an interactive 2D graph view and a numerical presentation of salient statistical parameters, such as regression coefficients, p-values, and others. Both help users in gaining a good understanding of the landscape of causal structures particularly when the number of variables is large. Our framework is also novel in that it can handle both numerical and categorical variables within one unified model and return plausible results. We demonstrate its use via a set of case studies using multiple practical datasets.